Example Scripts
General and quick start
Get the BSA example mzML file
-
get_example_BSA_file.main()¶ Downloads the BSA.mzML example file also used in openMS and Ursgal.
This file is ideally suited for the use with the example scripts to test pyQms.
Will download the BSA1.mzML to the data folder ( ../data/BSA1.mzML )
Usage:
./get_example_BSA_file.py
#!/usr/bin/env python3
# encoding: utf-8
"""
    pyQms
    -----

    Python module for fast and accurate mass spectrometry data quantification

    :license: MIT, see LICENSE.txt for more details

    Authors:

        * Leufken, J.
        * Niehues, A.
        * Sarin, L.P.
        * Hippler, M.
        * Leidel, S.A.
        * Fufezan, C.

"""
import sys
from urllib import request as request
import os
import shutil

def main():
    """
    Downloads the BSA.mzML example file also used in openMS and Ursgal.

    This file is ideally suited for the use with the example scripts to test
    pyQms.

    Will download the BSA1.mzML to the data folder ( ../data/BSA1.mzML )

    Usage:

        ./get_example_BSA_file.py

    """
    mzML_file = os.path.join(
        os.pardir,
        'data',
        'BSA1.mzML'
    )
    if os.path.exists(mzML_file) is False:
        http_url = 'http://sourceforge.net/p/open-ms/code/HEAD/tree/OpenMS/share/OpenMS/examples/BSA/BSA1.mzML?format=raw'
        basename = os.path.basename(http_url).replace('?','') #Win compatible
        output_path = os.path.join( os.path.dirname(mzML_file), basename)
        with open( output_path, 'wb') as ooo:
            local_filename, headers = request.urlretrieve(
                http_url,
                filename = output_path,
            )
        try:
            shutil.move(
                '{0}?format=raw'.format(mzML_file),
                mzML_file
            )
        except:
            shutil.move(
                '{0}format=raw'.format(mzML_file),
                mzML_file
            )
        print(
            'Saved file as {0}'.format(
                mzML_file,
            )
        )

    return


if __name__ == '__main__':
    main()
Basic usage
Parse ident file and quantify
#!/usr/bin/env python3
# encoding: utf-8
"""
    pyQms
    -----

    Python module for fast and accurate mass spectrometry data quantification

    :license: MIT, see LICENSE.txt for more details

    Authors:

        * Leufken, J.
        * Niehues, A.
        * Sarin, L.P.
        * Hippler, M.
        * Leidel, S.A.
        * Fufezan, C.

"""
import pyqms
import sys
import pickle
import os
import pyqms.adaptors
try:
    import pymzml
except:
    print('Please install pymzML via: pip install pymzml')


def main(ident_file=None, mzml_file=None):
    """
    Script to automatically parse `Ursgal`_ result files and quantify it via
    pyQms. Please refer to Documenation of :doc:`adaptors` for further
    information.

    `Ursgal`_ result files or files in `mzTab` format are read in and used for
    quantification of the BSA example file.

    Note:

        Use e.g. the BSA1.mzML example file. Please download it first using
        'get_example_BSA_file.py'. Evidence files can also be found in the
        data folder 'BSA1_omssa_2_1_9_unified.csv' or 'BSA1_omssa_2_1_9.mztab'

    Usage:

        ./parse_ident_file_and_quantify.py <ident_file> <mzml_file>

    .. _Ursgal:
        https://github.com/ursgal/ursgal

    .. _mzTab:
        http://www.psidev.info/mztab

    """

    if ident_file.upper().endswith('MZTAB'):
        evidence_score_field  = 'search_engine_score[1]'
    else:
        # this is the default value in the adaptor
        evidence_score_field = 'PEP'

    print(
        'Evidence score field "{0}" will be used.'.format(
            evidence_score_field
        )
    )

    fixed_labels, evidences, molecules = pyqms.adaptors.parse_evidence(
        fixed_labels         = None,
        evidence_files       = [ ident_file ],
        evidence_score_field = evidence_score_field
    )

    params = {
        'molecules'        : molecules,
        'charges'          : [1, 2, 3, 4, 5],
        'metabolic_labels' : {'15N' : [0]},
        'fixed_labels'     : fixed_labels,
        'verbose'          : True,
        'evidences'        : evidences
    }

    lib = pyqms.IsotopologueLibrary( **params )

    run = pymzml.run.Reader(
        mzml_file
    )
    out_folder         = os.path.dirname(mzml_file)
    mzml_file_basename = os.path.basename(mzml_file)
    results            = None
    for spectrum in run:
        try:
            # pymzML 2.0.0 style
            scan_time = spectrum.scan_time
        except:
            # scan time will be in seconds
            scan_time = spectrum.get('MS:1000016')
        if spectrum['ms level'] == 1:
            results = lib.match_all(
                mz_i_list = spectrum.centroidedPeaks,
                file_name = mzml_file_basename,
                spec_id   = spectrum['id'],
                spec_rt   = scan_time,
                results   = results
            )
    pickle.dump(
        results,
        open(
            os.path.join(
                out_folder,
                '{0}_pyQms_results.pkl'.format(
                    mzml_file_basename
                )
            ),
            'wb'
        )
    )
    return


if __name__ == '__main__':
    if len( sys.argv ) < 3:
        print(main.__doc__)
    else:
        main(
            ident_file = sys.argv[1],
            mzml_file  = sys.argv[2]
        )
Simple match on peak list
#!/usr/bin/env python3
# encoding: utf-8
"""
    pyQms
    -----

    Python module for fast and accurate mass spectrometry data quantification

    :license: MIT, see LICENSE.txt for more details

    Authors:

        * Leufken, J.
        * Niehues, A.
        * Sarin, L.P.
        * Hippler, M.
        * Leidel, S.A.
        * Fufezan, C.

"""
import pyqms
import sys
import pickle
import os
import pprint


def main( mzml=None):
    """
    Example script as template for most basic usage of quantification using
    pyQms.

    Use spectrum 1165 of the BSA1.mzML example file. A subrange of the spectrum
    from m/z 400 to 500 is used.

    Usage:
        ./basic_quantification_example.py

    Note:
        This example does not require a reader to access ms spectra, since a
        simnple peak liost is used.

    """

    peak_list = [
        (404.2492407565097, 2652.905029296875),
        (405.3003310237508, 4831.56103515625),
        (408.8403673369115, 23153.7109375),
        (409.17476109421705, 10182.2822265625),
        (409.5098740355617, 4770.97412109375),
        (411.17196124490727, 3454.364013671875),
        (413.26627826402705, 6861.84912109375),
        (419.3157903165357, 90201.5625),
        (420.2440507067882, 11098.4716796875),
        (420.31917273788645, 22288.9140625),
        (420.73825281590496, 8159.7099609375),
        (421.2406187369968, 3768.656494140625),
        (427.3787652898548, 5680.43212890625),
        (433.3316647490907, 8430.30859375),
        (434.705984428002, 25924.38671875),
        (435.2080179219357, 11041.2060546875),
        (443.6708762397708, 4081.282470703125),
        (443.69049198141124, 5107.13330078125),
        (443.6974813419733, 9135.3125),
        (443.7112735313511, 2517650.0),
        (443.7282222289076, 5571.26025390625),
        (443.7379762316008, 5227.4033203125),
        (444.1998579474954, 3021.341796875),
        (444.21248374593875, 1156173.75),
        (444.71384916266277, 336326.96875),
        (445.21533524843596, 58547.0703125),
        (445.71700965093, 4182.04345703125),
        (446.1200302053469, 93216.3359375),
        (447.09963627699824, 3806.537109375),
        (447.1169242266495, 59846.37109375),
        (447.3464079857604, 13170.9541015625),
        (448.11566395552086, 9294.5107421875),
        (448.3500303628631, 3213.052490234375),
        (452.1123280000919, 5092.0869140625),
        (461.1934526664677, 4022.537353515625),
        (462.1463969367603, 99732.5),
        (463.14561508666384, 24247.015625),
        (464.1433022096936, 20417.041015625),
        (465.1421080732791, 3222.4052734375),
        (470.1669593722212, 8621.81640625),
        (475.23989190282134, 3369.073974609375),
        (493.27465300375036, 2725.885986328125),
        (496.0077303201583, 8604.0830078125),
    ]
    print('{0:-^100}'.format('Library generation'))
    lib = pyqms.IsotopologueLibrary(
        molecules        = [ 'DDSPDLPK' ],
        charges          = [ 2 ],
        metabolic_labels = None,
        fixed_labels     = None,
        verbose          = True
    )
    print('{0:-^100}'.format('Library generation'))

    results = lib.match_all(
        mz_i_list = peak_list,
        file_name = 'BSA_test',
        spec_id   = 1165,
        spec_rt   = 29.10,
        results   = None
    )
    print()
    print('{0:-^100}'.format('Results summary'))
    for key in results.keys():
        peptide = results.lookup['formula to molecule'][key.formula][0]
        print(
            'For Peptide {0} with formula {1} and charge {2} the following match could be made:'.format(
                peptide,
                key.formula,
                key.charge
            )
        )
        for match in results[key]['data']:
            print(
                '\tAmount {0:1.2f} (scaling_factor) was detected with a matching score of {1:1.2f}'.format(
                    match.scaling_factor,
                    match.score
                )
            )
            print(
                '\tThe follwowing peaks have been matched:'
            )
            for measured_mz, measured_intensity, relative_i, calculated_mz, calculated_intensity in match.peaks:
                print(
                    '\t\t{0:1.6f} m/z @ {1:1.2e} intensity'.format(
                        measured_mz,
                        measured_intensity
                    )
                )
    print('{0:-^100}'.format('Results summary'))
    return


if __name__ == '__main__':
    main()
View result pkl stats
-
view_result_pkl_stats.main(result_pkl=None)¶ - usage:
- ./view_result_pkl_stats.py <Path2ResultPkl>
This script will show the stats of a result pkl file. Can be used to query the number of quantified formulas and charge states etc.
#!/usr/bin/env python3
# encoding: utf-8
"""
    pyQms
    -----

    Python module for fast and accurate mass spectrometry data quantification

    :license: MIT, see LICENSE.txt for more details

    Authors:

        * Leufken, J.
        * Niehues, A.
        * Sarin, L.P.
        * Hippler, M.
        * Leidel, S.A.
        * Fufezan, C.

"""
import pickle
import sys


def main(result_pkl=None):
    '''

    usage:
        ./view_result_pkl_stats.py <Path2ResultPkl>

    This script will show the stats of a result pkl file. Can be used to query
    the number of quantified formulas and charge states etc.

    '''
    results_class = pickle.load(
        open(
            result_pkl,
            'rb'
        )
    )
    print('Result pkl file holds the following information:')
    print()
    for key, value in results_class.index.items():
        print(
            'Number of {0: <20}: {1}'.format(
                key,
                len(value)
            )
        )
        print('\tExample values (up to 5): {0}'.format(list(value)[:5]))
        print()

if __name__ == '__main__':
    if len( sys.argv ) < 2:
        print(main.__doc__)
    else:
        main(
            result_pkl = sys.argv[1],
        )
Access the result class
-
access_result_class.main(result_pkl=None)¶ - usage:
- ./access_result_class.py <Path2ResultPkl>
This script will produce a dictionary with all summed up peptide amounts. The main idea is to show how to access the result pkl and loop over the data structure.
Note
Since no filters (score, RT windows, etc.) are applied, this script should not be used to estimate the actual amount of the quantified molecules in the results pkl.
#!/usr/bin/env python3
# encoding: utf-8
"""
    pyQms
    -----

    Python module for fast and accurate mass spectrometry data quantification

    :license: MIT, see LICENSE.txt for more details

    Authors:

        * Leufken, J.
        * Niehues, A.
        * Sarin, L.P.
        * Hippler, M.
        * Leidel, S.A.
        * Fufezan, C.

"""
import pickle
import sys
import pprint


def main(result_pkl=None):
    '''

    usage:
        ./access_result_class.py <Path2ResultPkl>

    This script will produce a dictionary with all summed up peptide amounts.
    The main idea is to show how to access the result pkl and loop over the
    data structure.

    Note:

        Since no filters (score, RT windows, etc.) are applied, this script
        should not be used to estimate the actual amount of the quantified
        molecules in the results pkl.


    '''
    results_class = pickle.load(
        open(
            result_pkl,
            'rb'
        )
    )

    amount_collector = {}

    for key, value in results_class.items():
        peptide = results_class.lookup['formula to molecule'][key.formula][0]
        if peptide not in amount_collector.keys():
            amount_collector[ peptide ] = {
                'amount' : 0
            }
        for matched_spectrum in value['data']:
            amount_collector[peptide]['amount'] += matched_spectrum.scaling_factor

    pprint.pprint(
        amount_collector
    )


if __name__ == '__main__':
    if len( sys.argv ) < 2:
        print(main.__doc__)
    else:
        main(
            result_pkl = sys.argv[1],
        )
Generate quant summary file
-
generate_quant_summary_file.main(result_pkl=None)¶ - usage:
- ./generate_quant_summary_file.py <Path2ResultPkl>
This script will produce quant summary file with all according evidence information which are stored in the result pkl file. Amounts (maxI) will be calculated if possible.
Note
Make sure, an evidence lookup is provided in the results class, so that retention time windows can be defined. Otherwise no meaningful amounts can be calculated.
Warning
Can take very long depending on pkl size!
#!/usr/bin/env python3
# encoding: utf-8
"""
    pyQms
    -----

    Python module for fast and accurate mass spectrometry data quantification

    :license: MIT, see LICENSE.txt for more details

    Authors:

        * Leufken, J.
        * Niehues, A.
        * Sarin, L.P.
        * Hippler, M.
        * Leidel, S.A.
        * Fufezan, C.

"""
import pickle
import sys


def main(result_pkl=None):
    '''

    usage:
        ./generate_quant_summary_file.py <Path2ResultPkl>

    This script will produce quant summary file with all according evidence
    information which are stored in the result pkl file. Amounts (maxI) will be
    calculated if possible.

    Note:

        Make sure, an evidence lookup is provided in the results class, so that
        retention time windows can be defined. Otherwise no meaningful amounts
        can be calculated.


    Warning:

        Can take very long depending on pkl size!

    '''
    results_class = pickle.load(
        open(
            result_pkl,
            'rb'
        )
    )
    rt_border_tolerance = 1
    # quant_summary_file  = '{0}_quant_summary.csv'.format(result_pkl)
    quant_summary_file  = '{0}_quant_summary.xlsx'.format(result_pkl)
    results_class.write_rt_info_file(
        output_file         = quant_summary_file,
        list_of_csvdicts    = None,
        trivial_name_lookup = None,
        rt_border_tolerance = rt_border_tolerance,
        update              = True
    )
    results_class.calc_amounts_from_rt_info_file(
        rt_info_file         = quant_summary_file,
        rt_border_tolerance  = rt_border_tolerance,
        calc_amount_function = None
    )
    return

if __name__ == '__main__':
    if len( sys.argv ) < 2:
        print(main.__doc__)
    else:
        main(
            result_pkl = sys.argv[1],
        )
Write raw quant results as csv
-
write_raw_result_csv.main(result_pkl=None)¶ - usage:
- ./write_raw_result_csv.py <Path2ResultPkl>
Will write all results of a result pkl into a .csv file. Please refer to Documentation of Result Class for further information.
Warning
The resulting .csv files can become very large depending on the provided pkl file!
Keys in csv:
- Formula : molecular formula of the molecule (str)
- Molecule : molecule or trivial name (str)
- Charge : charge of the molecule (int)
- ScanID : ScanID of the quantified spectrum (int)
- Label Percentiles : Labeling percentile ( (element, enrichment in %), )
- Amount : the determined amount of the molecule
- Retention Time : retetention time of the ScanID
- mScore : score of the isotopologue match
- Filename : filename of spectrum input files
#!/usr/bin/env python3
# encoding: utf-8
"""
    pyQms
    -----

    Python module for fast and accurate mass spectrometry data quantification

    :license: MIT, see LICENSE.txt for more details

    Authors:

        * Leufken, J.
        * Niehues, A.
        * Sarin, L.P.
        * Hippler, M.
        * Leidel, S.A.
        * Fufezan, C.

"""
import pickle
import sys


def main(result_pkl=None):
    '''

    usage:
        ./write_raw_result_csv.py <Path2ResultPkl>

    Will write all results of a result pkl into a .csv file. Please refer to
    Documentation of :doc:`results` for further information.

    Warning:

        The resulting .csv files can become very large depending on the provided
        pkl file!

    Keys in csv:

        * Formula           : molecular formula of the molecule (str)
        * Molecule          : molecule or trivial name (str)
        * Charge            : charge of the molecule (int)
        * ScanID            : ScanID of the quantified spectrum (int)
        * Label Percentiles : Labeling percentile ( (element, enrichment in %), )
        * Amount            : the determined amount of the molecule
        * Retention Time    : retetention time of the ScanID
        * mScore            : score of the isotopologue match
        * Filename          : filename of spectrum input files

    '''
    results_class = pickle.load(
        open(
            result_pkl,
            'rb'
        )
    )

    results_class.write_result_csv(
        output_file_name= '{0}_raw_results.csv'.format(result_pkl)
    )

if __name__ == '__main__':
    if len( sys.argv ) < 2:
        print(main.__doc__)
    else:
        main(
            result_pkl = sys.argv[1],
        )
Write results as mzTab
-
write_mztab_result.main(result_pkl=None)¶ - usage:
- ./write_mztab_results.py <Path2ResultPkl>
Will write all results of a result pkl into a .mztab file. Please refer to Documentation of Result Class for further information.
Note
Please note that the ouput in mzTab format is still in beta stage. Since pyQms is a raw quantification tool, some meta data has to be passed/set manually by the user.
#!/usr/bin/env python3
# encoding: utf-8
"""
    pyQms
    -----

    Python module for fast and accurate mass spectrometry data quantification

    :license: MIT, see LICENSE.txt for more details

    Authors:

        * Leufken, J.
        * Niehues, A.
        * Sarin, L.P.
        * Hippler, M.
        * Leidel, S.A.
        * Fufezan, C.

"""
import pickle
import sys


def main(result_pkl=None):
    '''

    usage:
        ./write_mztab_results.py <Path2ResultPkl>

    Will write all results of a result pkl into a .mztab file. Please refer to
    Documentation of :doc:`results` for further information.

    Note:

        Please note that the ouput in mzTab format is still in beta stage.
        Since pyQms is a raw quantification tool, some meta data has to be
        passed/set manually by the user.

    '''
    results_class = pickle.load(
        open(
            result_pkl,
            'rb'
        )
    )

    results_class.write_result_mztab(
        output_file_name = '{0}_results.mztab'.format(result_pkl)
    )

if __name__ == '__main__':
    if len( sys.argv ) < 2:
        print(main.__doc__)
    else:
        main(
            result_pkl = sys.argv[1],
        )
Write results as mzTab (BSA example)
-
write_BSA_mztab_results.main(result_pkl=None)¶ - usage:
- ./write_mztab_results.py <Path2ResultPkl>
Will write all results of a result pkl into a .mztab file. Please refer to Documentation of Result Class for further information.
Warning
This example script is specifically for the BSA1.mzML quantification results, since file specific meta data is passed. Please use ‘write_mztab_results.py’ for a more general script to produce mzTab results.
Note
Please note that the ouput in mzTab format is still in beta stage. Since pyQms is a raw quantification tool, some meta data has to be passed/set manually by the user.
#!/usr/bin/env python3
# encoding: utf-8
"""
    pyQms
    -----

    Python module for fast and accurate mass spectrometry data quantification

    :license: MIT, see LICENSE.txt for more details

    Authors:

        * Leufken, J.
        * Niehues, A.
        * Sarin, L.P.
        * Hippler, M.
        * Leidel, S.A.
        * Fufezan, C.

"""
import pickle
import sys


def main(result_pkl=None):
    '''

    usage:
        ./write_mztab_results.py <Path2ResultPkl>

    Will write all results of a result pkl into a .mztab file. Please refer to
    Documentation of :doc:`results` for further information.

    Warning:

        This example script is specifically for the BSA1.mzML quantification
        results, since file specific meta data is passed. Please use
        'write_mztab_results.py' for a more general script to produce mzTab
        results.

    Note:

        Please note that the ouput in mzTab format is still in beta stage.
        Since pyQms is a raw quantification tool, some meta data has to be
        passed/set manually by the user.

    '''
    results_class = pickle.load(
        open(
            result_pkl,
            'rb'
        )
    )
    # provide meta data as lists of mztab specific formats. Pass directly
    # mztab correct format.

    mztab_meta_info = {
        'protein_search_engine_score'   : [],
        'psm_search_engine_score'       : ['[MS,MS:1001475,OMSSA:evalue, ]'],
        'fixed_mod'                     : ['[UNIMOD, UNIMOD:4, Carbamidomethyl, ]'],
        'variable_mod'                  : ['[UNIMOD, UNIMOD:35, Oxidation, ]'],
        'study_variable-description'    : ['Standard BSA measurement'],
        'ms_run-location'               : ['BSA1.mzML'],

    }

    results_class.lookup['mztab_meta_info'] = mztab_meta_info

    results_class.write_result_mztab(
        output_file_name = '{0}_results.mztab'.format(result_pkl)
    )

if __name__ == '__main__':
    if len( sys.argv ) < 2:
        print(main.__doc__)
    else:
        main(
            result_pkl = sys.argv[1],
        )
Advanced usage
Parse ident file and quantify (with CAM)
#!/usr/bin/env python3
# encoding: utf-8
"""
    pyQms
    -----

    Python module for fast and accurate mass spectrometry data quantification

    :license: MIT, see LICENSE.txt for more details

    Authors:

        * Leufken, J.
        * Niehues, A.
        * Sarin, L.P.
        * Hippler, M.
        * Leidel, S.A.
        * Fufezan, C.

"""
import pyqms
import sys
import pickle
import os
import pyqms.adaptors
try:
    import pymzml
except:
    print('Please install pymzML via: pip install pymzml')


def main(ident_file=None, mzml_file=None):
    '''

    Script to automatically parse `Ursgal`_ result files and quantify it via
    pyQms.

    For evidence files with molecules with Caramidomethylation as fixed
    modification. These mode will be stripped from the molecules. This is
    important if an metabolic label (like 15N) is applied. This ensures that the
    nitrogens pools of the peptides (which are 15N labeled) do not mix up with
    the nitrogen pool of the Carbamidomethylation (14N since intriduced during
    sample preparation). Please refer to Documenation of :doc:`adaptors` for
    further information.

    `Ursgal`_ result files or files in `mzTab` format are read in and used for
    quantification of the BSA example file.

    Note:

        Use e.g. the BSA1.mzML example file. Please download it first using
        'get_example_BSA_file.py'. Evidence files can also be found in the
        data folder 'BSA1_omssa_2_1_9_unified.csv' or 'BSA1_omssa_2_1_9.mztab'

    Usage:

        ./parse_ident_file_and_quantify_with_carbamidomethylation.py <ident_file> <mzml_file>

    .. _Ursgal:
        https://github.com/ursgal/ursgal

    .. _mzTab:
        http://www.psidev.info/mztab

    '''

    # define the fixed label for Caramidomethyl
    tmp_fixed_labels = {
        'C' : [
            {
                'element_composition' : {'O': 1, 'H': 3, '14N': 1, 'C': 2},
                'evidence_mod_name': 'Carbamidomethyl'
            },
        ]
    }

    formatted_fixed_labels, evidence_lookup, molecule_list = pyqms.adaptors.parse_evidence(
        fixed_labels   = tmp_fixed_labels,
        evidence_files = [ ident_file ],
    )

    params = {
        'molecules'        : molecule_list,
        'charges'          : [1, 2, 3, 4, 5],
        'metabolic_labels' : {'15N' : [0, ]},
        'fixed_labels'     : formatted_fixed_labels,
        'verbose'          : True,
        'evidences'        : evidence_lookup
    }

    lib = pyqms.IsotopologueLibrary( **params )

    run = pymzml.run.Reader(
        mzml_file
    )
    out_folder         = os.path.dirname(mzml_file)
    mzml_file_basename = os.path.basename(mzml_file)
    results = None
    for spectrum in run:
        spec_id = spectrum['id']
        try:
            # pymzML 2.0.0 style
            scan_time = spectrum.scan_time
        except:
            # scan time will be in seconds
            scan_time = spectrum.get('MS:1000016')
        if spectrum['ms level'] == 1:
            results = lib.match_all(
                mz_i_list = spectrum.centroidedPeaks,
                file_name = mzml_file_basename,
                spec_id   = spectrum['id'],
                spec_rt   = scan_time,
                results   = results
            )

    pickle.dump(
        results,
        open(
            os.path.join(
                out_folder,
                '{0}_pyQms_results.pkl'.format(
                    mzml_file_basename
                )
            ),
            'wb'
        )
    )
    return


if __name__ == '__main__':
    if len( sys.argv ) < 3:
        print(main.__doc__)
    else:
        main(
            ident_file = sys.argv[1],
            mzml_file  = sys.argv[2]
        )
Complete quantification - from identification csv to peptide abundances
#!/usr/bin/env python3
# encoding: utf-8
"""
    pyQms
    -----

    Python module for fast and accurate mass spectrometry data quantification

    :license: MIT, see LICENSE.txt for more details

    Authors:

        * Leufken, J.
        * Niehues, A.
        * Sarin, L.P.
        * Hippler, M.
        * Leidel, S.A.
        * Fufezan, C.

"""
import pyqms
import sys

import pickle
import os
import pyqms.adaptors
try:
    import pymzml
except:
    print('Please install pymzML via: pip install pymzml')


def main(ident_file = None, mzml_file = None):
    '''
    Examples script to demonstrate a (example) workflow from mzML files to
    peptide abundances. Will plot for every quantified peptide a matched
    isotopologue chromatogram (MIC). The plots include RT windows, maximum
    amount in RT window and identification RT(s).

    `Ursgal`_ result files or files in `mzTab` format are read in and used for
    quantification of the BSA example file.

    Note:

        Use e.g. the BSA1.mzML example file. Please download it first using
        'get_example_BSA_file.py'. Evidence files can also be found in the
        data folder 'BSA1_omssa_2_1_9_unified.csv' or 'BSA1_omssa_2_1_9.mztab'

    Usage:

        ./complete_BSA_quantification.py <ident_file> <mzml_file>

    .. _Ursgal:
        https://github.com/ursgal/ursgal

    .. _mzTab:
        http://www.psidev.info/mztab

    Note:
        rpy2 is required for all plotting

    '''

    # define the fixed label for Carbamidomethyl
    tmp_fixed_labels = {
        'C' : [
            {
                'element_composition' : {'O': 1, 'H': 3, '14N': 1, 'C': 2},
                'evidence_mod_name': 'Carbamidomethyl'
            },
        ]
    }
    if ident_file.upper().endswith('MZTAB'):
        evidence_score_field  = 'search_engine_score[1]'
    else:
        # this is the default value in the adaptor
        evidence_score_field = 'PEP'

    print(
        'Evidence score field "{0}" will be used.'.format(
            evidence_score_field
        )
    )
    formatted_fixed_labels, evidence_lookup, molecule_list = pyqms.adaptors.parse_evidence(
        fixed_labels         = tmp_fixed_labels,
        evidence_files       = [ ident_file ],
        evidence_score_field = evidence_score_field
    )

    params = {
        'molecules'        : molecule_list,
        'charges'          : [1, 2, 3, 4, 5],
        'metabolic_labels' : {'15N' : [0, ]},
        'fixed_labels'     : formatted_fixed_labels,
        'verbose'          : True,
        'evidences'        : evidence_lookup
    }

    lib = pyqms.IsotopologueLibrary( **params )

    run = pymzml.run.Reader(
        mzml_file
    )
    out_folder         = os.path.dirname(mzml_file)
    mzml_file_basename = os.path.basename(mzml_file)
    results = None
    for spectrum in run:
        spec_id   = spectrum['id']
        try:
            # pymzML 2.0.0 style
            scan_time = spectrum.scan_time
        except:
            # scan time will be in seconds
            scan_time = spectrum.get('MS:1000016')
        if spectrum['ms level'] == 1:
            results = lib.match_all(
                mz_i_list = spectrum.centroidedPeaks,
                file_name = mzml_file_basename,
                spec_id   = spectrum['id'],
                spec_rt   = scan_time,
                results   = results
            )
    # print(results)
    out_folder = os.path.join(
        os.path.dirname(ident_file),
        'complete_BSA_quantification'
    )
    if os.path.exists(out_folder) is False:
        os.mkdir(out_folder)
    print()
    print('All results go into folder: {0}'.format(out_folder))
    rt_border_tolerance = 1
    quant_summary_file  = os.path.join(
        out_folder,
        'complete_BSA_quantification_summary.xlsx',
    )
    results.write_rt_info_file(
        output_file         = quant_summary_file,
        list_of_csvdicts    = None,
        trivial_name_lookup = None,
        rt_border_tolerance = rt_border_tolerance,
        update              = True
    )
    calculated_amounts = results.calc_amounts_from_rt_info_file(
        rt_info_file         = quant_summary_file,
        rt_border_tolerance  = rt_border_tolerance,
        calc_amount_function = None, # calc_amount_function
    )
    # print(calculated_amounts)
    formula_charge_to_quant_info = {}
    for line_dict in calculated_amounts:
        formula_charge_to_quant_info[ (line_dict['formula'], int(line_dict['charge'])) ] = {
            'rt'           : line_dict['max I in window (rt)'],
            'amount'       : line_dict['max I in window'],
            'rt start'     : line_dict['start (min)'],
            'rt stop'      : line_dict['stop (min)'],
            'evidence_rts' : [],
        }
        if len(formula_charge_to_quant_info[ (line_dict['formula'], int(line_dict['charge'])) ]['evidence_rts']) == 0:
            for ev_string in line_dict['evidences (min)'].split(';'):
                formula_charge_to_quant_info[ (line_dict['formula'], int(line_dict['charge'])) ]['evidence_rts'].append(
                    round( float( ev_string.split('@')[1] ), 2 )
                )
    import_ok = False
    try:
        import rpy2
        import_ok = True
    except:
        pass
    if import_ok:
        print('Plotting results plot including RT windows, abundances and identifications')
        for key in results.keys():
            short_key = ( key.formula, key.charge )

            match_list = results[key]['data']
            if len(match_list) < 15:
                continue
            file_name = os.path.join(
                out_folder ,
                'MIC_2D_{0}_{1}.pdf'.format(
                    '_'.join(
                        results.lookup['formula to molecule'][ key.formula ]
                    ),
                    key.charge,
                )
            )
            graphics, grdevices = results.init_r_plot(file_name)

            ablines = {
                key : [
                    {
                        'v'   : formula_charge_to_quant_info[short_key]['rt'],
                        'lty' : 2
                    },
                    {
                        'v'   : formula_charge_to_quant_info[short_key]['rt start'],
                        'lty' : 2,
                        'col' : 'blue'
                    },
                    {
                        'v'   : formula_charge_to_quant_info[short_key]['rt stop'],
                        'lty' : 2,
                        'col' : 'blue'
                    },
                ]
            }
            # print(formula_charge_to_quant_info[short_key])
            additional_legends = {
                key : [
                    {
                        'x'    : formula_charge_to_quant_info[short_key]['rt'],
                        'y'    : formula_charge_to_quant_info[short_key]['amount'],
                        'text' : 'max intensity: {0:1.3e}'.format(
                            formula_charge_to_quant_info[short_key]['amount'],
                        ),
                        'pos'  : 3 # above
                    },
                    {
                        'x'    : formula_charge_to_quant_info[short_key]['rt start'],
                        'y'    : formula_charge_to_quant_info[short_key]['amount'] / 2,
                        'text' : 'RT Window start',
                        'pos'  : 4, # right
                        'col'  : 'blue'
                    },
                    {
                        'x'    : formula_charge_to_quant_info[short_key]['rt stop'],
                        'y'    : formula_charge_to_quant_info[short_key]['amount'] / 2,
                        'text' : 'RT window stop',
                        'pos'  : 2, # left,
                        'col'  : 'blue'
                    },
                ]
            }

            for evidence_rt in formula_charge_to_quant_info[short_key]['evidence_rts']:
                ablines[key].append(
                    {
                        'v'   : evidence_rt,
                        'lwd' : 0.5,
                        'col' : 'purple',
                    }
                )
                additional_legends[key].append(
                    {
                        'x'    : evidence_rt,
                        'y'    : 0,
                        'lwd'  : 0.5,
                        'col'  : 'purple',
                        'text' : 'MS2 ident',
                        'pos'  : 4,
                        'srt'  : 45 # rotate label
                    }
                )

            results.plot_MICs_2D(
                [key],
                file_name          = None,
                rt_window          = None,
                i_transform        = None,
                xlimits            = [
                    formula_charge_to_quant_info[short_key]['rt start']-0.05,
                    formula_charge_to_quant_info[short_key]['rt stop']+0.05,

                ],
                additional_legends = additional_legends,
                title              = None,
                zlimits            = None,
                ablines            = ablines,
                graphics           = graphics
            )
            print(
                'Plottted {0}'.format(file_name)
            )

    return


if __name__ == '__main__':
    if len( sys.argv ) < 3:
        print(main.__doc__)
    else:
        main(
            ident_file = sys.argv[1],
            mzml_file  = sys.argv[2]
        )
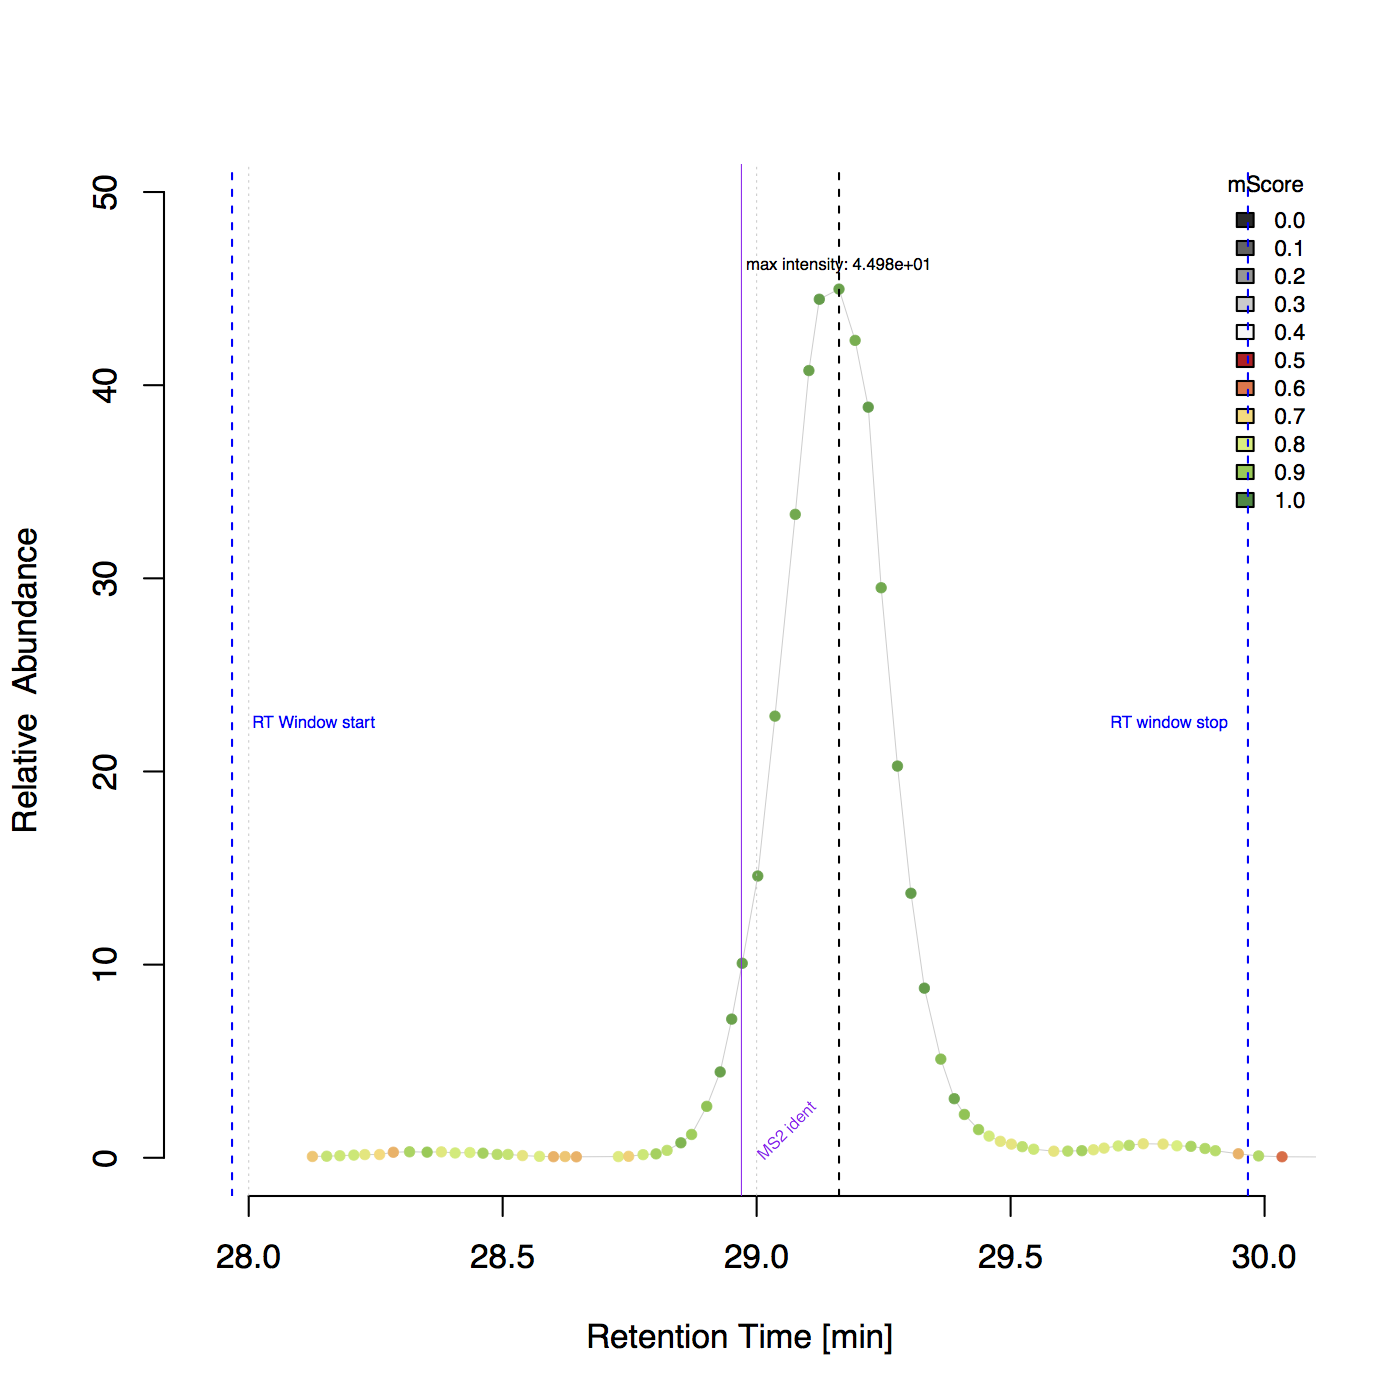
Example plot including RT borders and identification information
Example plot for peptide ‘DDSPDLPK’ with charge 2 in the BSA1.mzML file.
Plotting and visualizattion
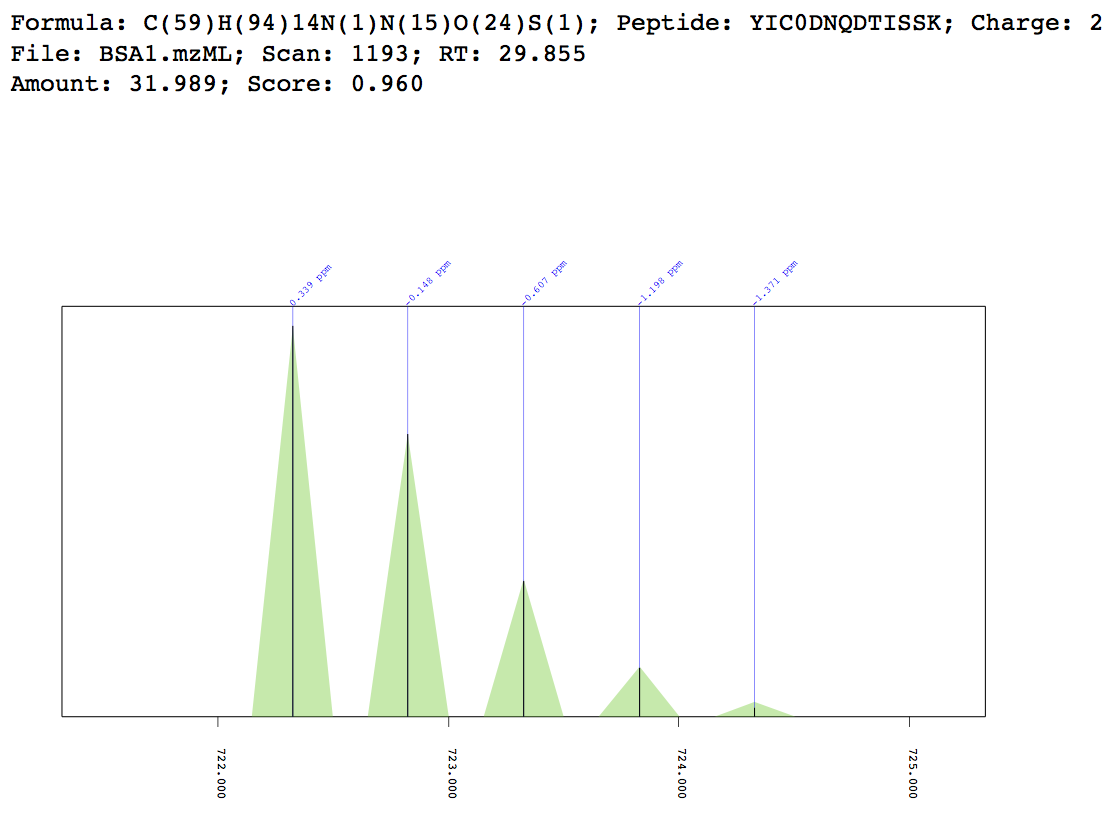
Plot example match
-
plot_match_examples.main(result_pkl=None)¶ - usage:
- ./plot_match_examples.py <Path2ResultPkl>
Extracts the match information and plots one example isotopologue match into the ‘data’ folder. Uses the plot function of pymzML (pymzML.plot). Use this script as template for annotating spectra with match information.
Note
Plots only one high scored formula (mScore >0.95) from the result pkl. Use e.g. with the ‘BSA1.mzML_pyQms_results.pkl’ obtained from e.g. example script parse_ident_file_and_quantify_with_carbamidomethylation.py to get example plotting data.
#!/usr/bin/env python3
# encoding: utf-8
"""
    pyQms
    -----

    Python module for fast and accurate mass spectrometry data quantification

    :license: MIT, see LICENSE.txt for more details

    Authors:

        * Leufken, J.
        * Niehues, A.
        * Sarin, L.P.
        * Hippler, M.
        * Leidel, S.A.
        * Fufezan, C.

"""
import pickle
import sys
import os
try:
    import pymzml
    import pymzml.plot
except:
    print('Please install pymzML via: pip install pymzml')


def main(result_pkl=None):
    '''

    usage:
        ./plot_match_examples.py <Path2ResultPkl>

    Extracts the match information and plots one example isotopologue match into
    the 'data' folder. Uses the plot function of pymzML (`pymzML.plot`_). Use
    this script as template for annotating spectra with match information.

    Note:

        Plots only one high scored formula (mScore >0.95) from the result pkl.
        Use e.g. with the 'BSA1.mzML_pyQms_results.pkl' obtained from e.g.
        example script parse_ident_file_and_quantify_with_carbamidomethylation.py
        to get example plotting data.

    .. _pymzML.plot:
        https://pymzml.github.io/plot.html

    '''
    results_class = pickle.load(
        open(
            result_pkl,
            'rb'
        )
    )

    for key, i, entry in results_class.extract_results():
        if entry.score > 0.95:
            p = pymzml.plot.Factory()
            label_x           = []
            measured_peaks    = []
            matched_peaks     = []
            for measured_mz, measured_intensity, relative_i, calculated_mz, calculated_intensity in entry.peaks:
                if measured_mz is not None:
                    measured_peaks.append( (measured_mz, measured_intensity) )
                    matched_peaks.append( (calculated_mz, calculated_intensity * entry.scaling_factor) )
                    label_x.append(
                        (
                            calculated_mz,
                            '{0:5.3f} ppm'.format(
                                (measured_mz - calculated_mz) / ( measured_mz * 1e-6 )
                            )
                        )
                    )

            mz_only  = [ n[0] for n in measured_peaks ]
            mz_range = [ min(mz_only)-1, max(mz_only)+1 ]
            peptides = results_class.lookup['formula to molecule'][key.formula]
            if len(peptides) > 1:
                continue
            p.newPlot(
                header = 'Formula: {0}; Peptide: {1}; Charge: {2}\n File: {3}; Scan: {4}; RT: {5:1.3f}\n Amount: {6:1.3f}; Score: {7:1.3f}'.format(
                    key.formula,
                    peptides[0],
                    key.charge,
                    key.file_name,
                    entry.spec_id,
                    entry.rt,
                    entry.scaling_factor,
                    entry.score
                ),
                mzRange = mz_range
            )
            p.add(
                measured_peaks,
                color = (0, 0, 0),
                style = 'sticks'
            )
            p.add(
                matched_peaks,
                color = (0, 200, 0),
                style = 'triangles'
            )
            p.add(
                label_x,
                color = (0, 0, 255),
                style = 'label_x'
            )

            plot_name = os.path.join(
                os.pardir,
                'data',
                '{0}_Peptide_{1}_Charge_{2}.xhtml'.format(
                    key.file_name,
                    peptides[0],
                    key.charge
                )
            )
            p.save(
                filename = plot_name,
                mzRange  = mz_range
            )
            print(
                'Plotted file {0}'.format(
                    plot_name
                )
            )
            break


if __name__ == '__main__':
    if len( sys.argv ) < 2:
        print(main.__doc__)
    else:
        main(
            result_pkl = sys.argv[1],
        )
Example match plot
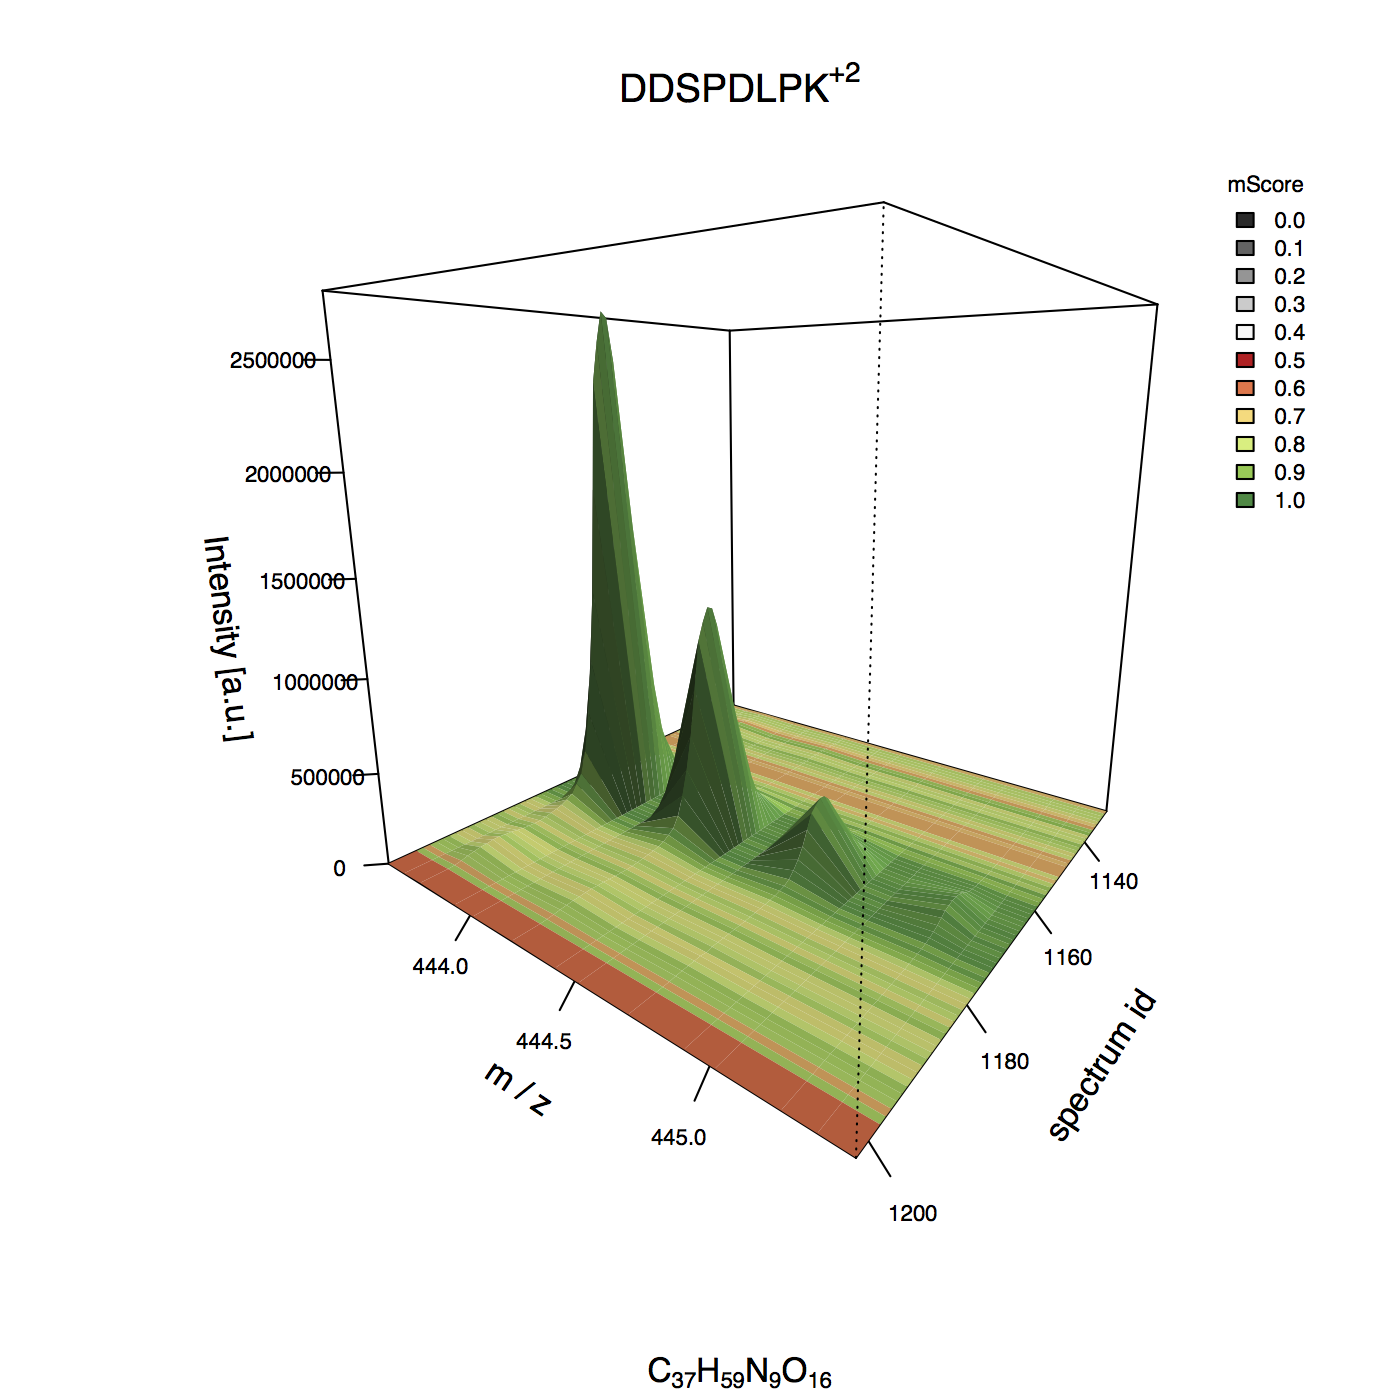
MIC 3D plot
-
mic_3d_plot.main(pickle_file)¶ - usage:
- ./mic_3d_plot.py <path_to_pickled_result_class>
Plots 3-dimensional matched isotope chromatograms (MICs) of pyQms quantification results.
Pickled result class can contain thousands of molecules therefore this example script stops plotting after 10 plotted MICs. Otherwise all quantified formula-charge-filename combinations will be plotted!
Use e.g. the BSA data example. Download via ‘get_example_BSA_file.py’ and quantify using ‘parse_ident_file_and_quantify_with_carbmidomethylation.py’.
Note
Installation of R and rpy2 is required.
#!/usr/bin/env python3
# encoding: utf-8
"""
    pyQms
    -----

    Python module for fast and accurate mass spectrometry data quantification

    :license: MIT, see LICENSE.txt for more details

    Authors:

        * Leufken, J.
        * Niehues, A.
        * Sarin, L.P.
        * Hippler, M.
        * Leidel, S.A.
        * Fufezan, C.

"""

import pickle
import sys
import os

try:
    import rpy2
except:
    print('rpy2 is not installed but required for plotting, please install it and try again')
    print('pip3.4 install rpy2')


def main(pickle_file):
    '''
    usage:
        ./mic_3d_plot.py <path_to_pickled_result_class>

    Plots 3-dimensional matched isotope chromatograms (MICs) of pyQms
    quantification results.

    Pickled result class can contain thousands of molecules therefore this
    example script stops plotting after 10 plotted MICs. Otherwise all
    quantified formula-charge-filename combinations will be plotted!

    Use e.g. the BSA data example. Download via 'get_example_BSA_file.py' and
    quantify using 'parse_ident_file_and_quantify_with_carbmidomethylation.py'.

    Note:

        Installation of R and rpy2 is required.

    '''
    results = pickle.load(
        open( pickle_file, 'rb')
    )
    out_folder = os.path.join(
        os.path.dirname(pickle_file),
        'plots'
    )
    if os.path.exists(out_folder) is False:
        os.mkdir(out_folder)
    print('Plotting into folder: {0}'.format(out_folder))
    if len( results.keys() ) > 10:
        print(
            '''
Result class should not hold more then 10 keys, to prevent plot overflow!
Will stop after 10 plots!
'''
        )
        # sys.exit()
    for n, key in enumerate(results.keys()):
        if n > 10:
            print('Stopping after 10 plots!')
            exit()
        if len(results[key]['data']) <= 15:
            continue
        mzml_filename = key.file_name
        if os.sep in mzml_filename:
            mzml_filename = os.path.basename(mzml_filename)

        file_name = os.path.join(
            out_folder ,
            'MIC_3D_{0}_{1}_{2}_{3}'.format(
                '_'.join(
                    results.lookup['formula to molecule'][ key.formula ]
                ),
                key.charge,
                key.label_percentiles,
                mzml_filename
            )
        )
        results.plot_MIC_3D(
            key,
            file_name = file_name,
        )

    return


if __name__ == '__main__':
    if len(sys.argv) <= 1:
        sys.exit(main.__doc__)
    main( sys.argv[1] )
Example 3D plot
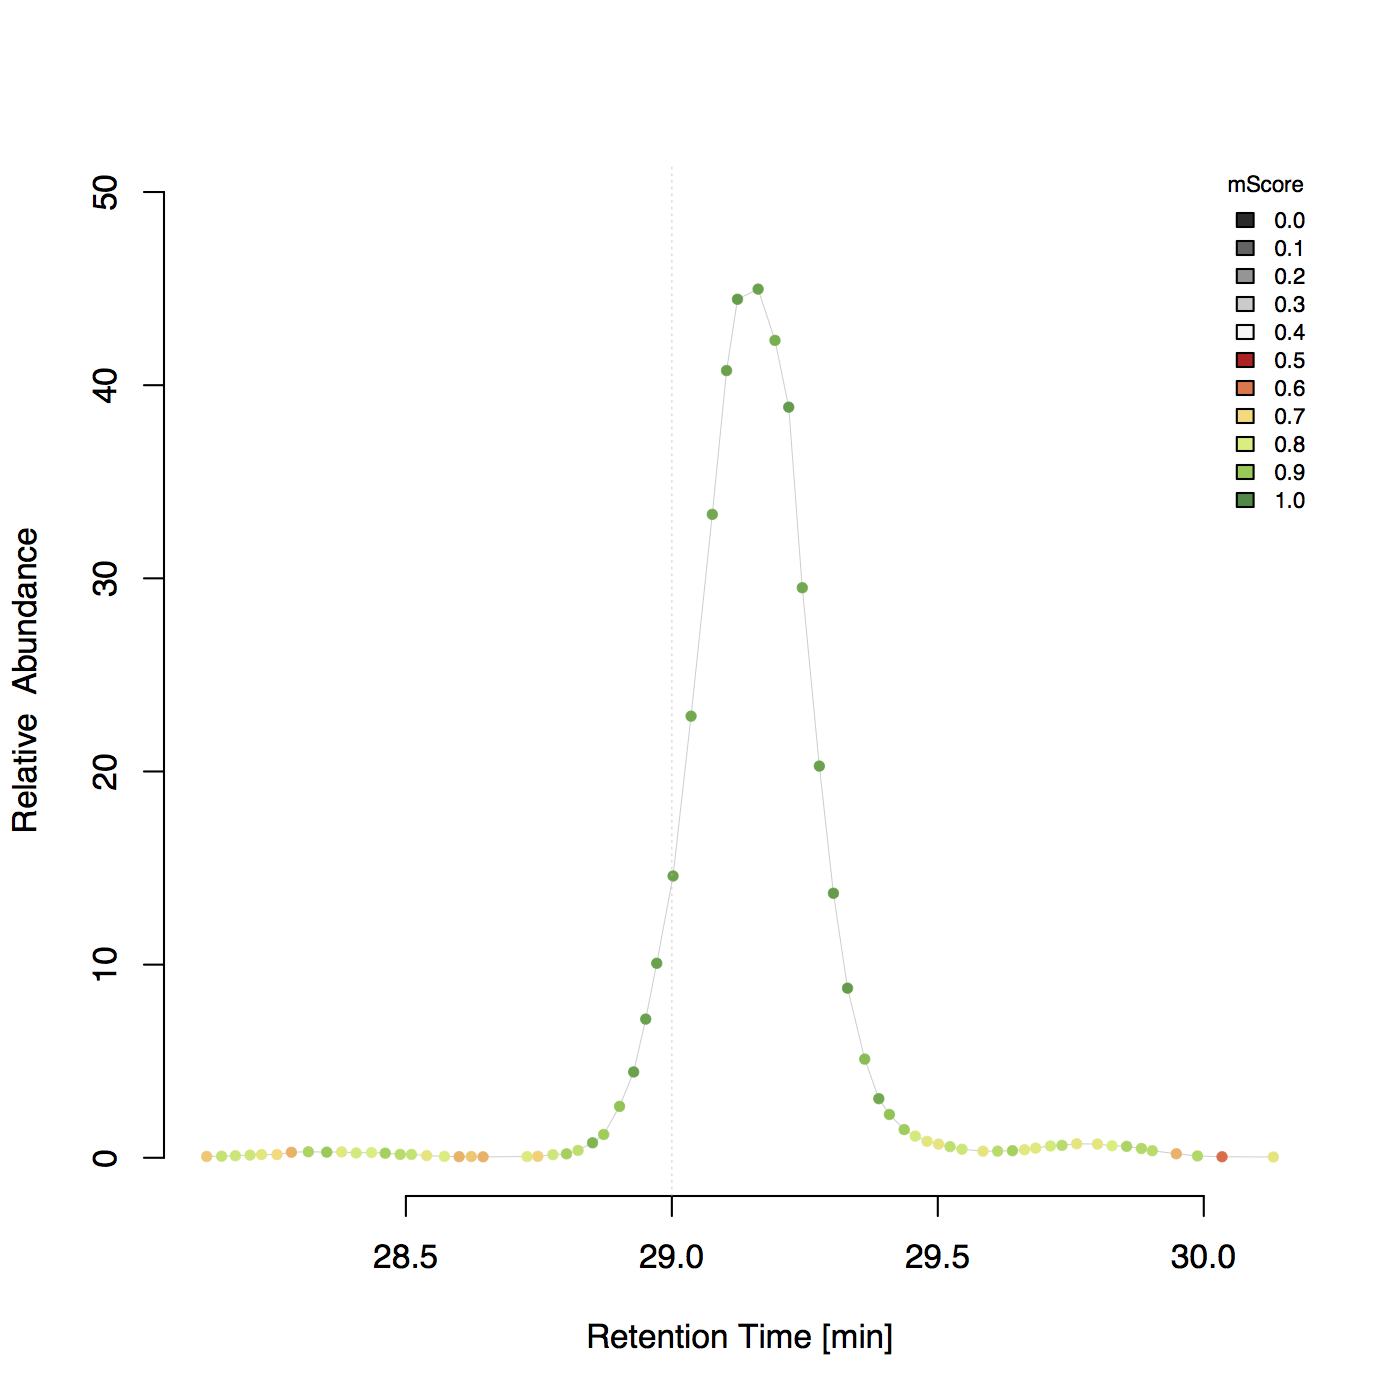
MIC 2D plot
-
mic_2d_plot.main(pickle_file)¶ - usage:
- ./mic_2d_plot.py <path_to_pickled_result_class>
Plots 2-dimensional matched isotope chromatograms (MICs) of pyQms quantification results.
Pickled result class can contain thousands of molecules therefore this example script stops plotting after 10 plotted MICs. Otherwise all quantified formula-charge-filename combinations will be plotted!
Use e.g. the BSA data example. Download via ‘get_example_BSA_file.py’ and quantify using ‘parse_ident_file_and_quantify_with_carbmidomethylation.py’.
Note
Installation of R and rpy2 is required.
#!/usr/bin/env python3
# encoding: utf-8
"""
    pyQms
    -----

    Python module for fast and accurate mass spectrometry data quantification

    :license: MIT, see LICENSE.txt for more details

    Authors:

        * Leufken, J.
        * Niehues, A.
        * Sarin, L.P.
        * Hippler, M.
        * Leidel, S.A.
        * Fufezan, C.

"""

import pickle
import sys
import os

try:
    import rpy2
except:
    print('rpy2 is not installed but required for plotting, please install it and try again')
    print('pip3.4 install rpy2')


def main(pickle_file):
    '''
    usage:
        ./mic_2d_plot.py <path_to_pickled_result_class>

    Plots 2-dimensional matched isotope chromatograms (MICs) of pyQms
    quantification results.

    Pickled result class can contain thousands of molecules therefore this
    example script stops plotting after 10 plotted MICs. Otherwise all
    quantified formula-charge-filename combinations will be plotted!

    Use e.g. the BSA data example. Download via 'get_example_BSA_file.py' and
    quantify using 'parse_ident_file_and_quantify_with_carbmidomethylation.py'.

    Note:

        Installation of R and rpy2 is required.

    '''
    results = pickle.load(
        open( pickle_file, 'rb')
    )
    out_folder = os.path.join(
        os.path.dirname(pickle_file),
        'plots'
    )
    if os.path.exists(out_folder) is False:
        os.mkdir(out_folder)
    print('Plotting into folder: {0}'.format(out_folder))
    if len( results.keys() ) > 10:
        print(
            '''
Result class should not hold more then 10 keys, to prevent plot overflow!
Will stop after 10 plots!
'''
        )
        # sys.exit()
    for n, key in enumerate(results.keys()):
        if n > 10:
            print('Stopping after 10 plots!')
            exit()
        if len(results[key]['data']) <= 15:
            continue
        mzml_filename = key.file_name
        if os.sep in mzml_filename:
            mzml_filename = os.path.basename(mzml_filename)

        file_name = os.path.join(
            out_folder ,
            'MIC_2D_{0}_{1}_{2}_{3}.pdf'.format(
                '_'.join(
                    results.lookup['formula to molecule'][ key.formula ]
                ),
                key.charge,
                key.label_percentiles,
                mzml_filename
            )
        )
        graphics, grdevices = results.init_r_plot(file_name)
        results.plot_MICs_2D(
            [key],
            graphics = graphics
        )


    return


if __name__ == '__main__':
    if len(sys.argv) <= 1:
        sys.exit(main.__doc__)
    main( sys.argv[1] )
Example 2D plot
Determine m/z and intensity errors
-
determine_mz_and_i_error.main(result_pkl=None)¶ - usage:
- ./determine_mz_and_i_error.py <Path2ResultPkl>
This script will determine the apparant mz and intensity error present in the quantifications for the given result pkl.
#!/usr/bin/env python3
# encoding: utf-8
"""
    pyQms
    -----

    Python module for fast and accurate mass spectrometry data quantification

    :license: MIT, see LICENSE.txt for more details

    Authors:

        * Leufken, J.
        * Niehues, A.
        * Sarin, L.P.
        * Hippler, M.
        * Leidel, S.A.
        * Fufezan, C.

"""
import pickle
import sys
import os


def main(result_pkl=None):
    '''

    usage:
        ./determine_mz_and_i_error.py <Path2ResultPkl>

    This script will determine the apparant mz and intensity error present
    in the quantifications for the given result pkl.


    '''
    results_class = pickle.load(
        open(
            result_pkl,
            'rb'
        )
    )

    plot_name = os.path.join(
        os.path.dirname(result_pkl),
        'mz_and_intensity_error_{0}.pdf'.format(
            os.path.basename(result_pkl)
        )
    )

    results_class._determine_measured_error(
        score_threshold = None,
        topX            = 3,
        filename        = plot_name,
        plot            = True
    )


if __name__ == '__main__':
    if len( sys.argv ) < 2:
        print(main.__doc__)
    else:
        main(
            result_pkl = sys.argv[1],
        )
Visualize errors on spectrum level
#!/usr/bin/env python3
# encoding: utf-8
"""
    pyQms
    -----

    Python module for fast and accurate mass spectrometry data quantification

    :license: MIT, see LICENSE.txt for more details

    Authors:

        * Leufken, J.
        * Niehues, A.
        * Sarin, L.P.
        * Hippler, M.
        * Leidel, S.A.
        * Fufezan, C.

"""
import pyqms
import sys
import pickle
import os
import pprint
from collections import defaultdict as ddict
try:
    import pymzml
except:
    print('Please install pymzML via: pip install pymzml')


def main( mzml=None):
    """
    Example script fort visualizing the m/z and intensity error, which is the
    basis for the scoring of the matches in pyQms.

    Use spectrum 1165 of the BSA1.mzML example file. A subrange of the spectrum
    from m/z 400 to 500 is used.

    Usage:
        ./visualize_scoring_information.py

    Note:
        This example does not require a reader to access MS spectra, since a
        simnple peak list is used.

    """

    peak_list = [
        (404.2492407565097, 2652.905029296875),
        (405.3003310237508, 4831.56103515625),
        (408.8403673369115, 23153.7109375),
        (409.17476109421705, 10182.2822265625),
        (409.5098740355617, 4770.97412109375),
        (411.17196124490727, 3454.364013671875),
        (413.26627826402705, 6861.84912109375),
        (419.3157903165357, 90201.5625),
        (420.2440507067882, 11098.4716796875),
        (420.31917273788645, 22288.9140625),
        (420.73825281590496, 8159.7099609375),
        (421.2406187369968, 3768.656494140625),
        (427.3787652898548, 5680.43212890625),
        (433.3316647490907, 8430.30859375),
        (434.705984428002, 25924.38671875),
        (435.2080179219357, 11041.2060546875),
        (443.6708762397708, 4081.282470703125),
        (443.69049198141124, 5107.13330078125),
        (443.6974813419733, 9135.3125),
        (443.7112735313511, 2517650.0),
        (443.7282222289076, 5571.26025390625),
        (443.7379762316008, 5227.4033203125),
        (444.1998579474954, 3021.341796875),
        (444.21248374593875, 1156173.75),
        (444.71384916266277, 336326.96875),
        (445.21533524843596, 58547.0703125),
        (445.71700965093, 4182.04345703125),
        (446.1200302053469, 93216.3359375),
        (447.09963627699824, 3806.537109375),
        (447.1169242266495, 59846.37109375),
        (447.3464079857604, 13170.9541015625),
        (448.11566395552086, 9294.5107421875),
        (448.3500303628631, 3213.052490234375),
        (452.1123280000919, 5092.0869140625),
        (461.1934526664677, 4022.537353515625),
        (462.1463969367603, 99732.5),
        (463.14561508666384, 24247.015625),
        (464.1433022096936, 20417.041015625),
        (465.1421080732791, 3222.4052734375),
        (470.1669593722212, 8621.81640625),
        (475.23989190282134, 3369.073974609375),
        (493.27465300375036, 2725.885986328125),
        (496.0077303201583, 8604.0830078125),
    ]
    print('{0:-^100}'.format('Library generation'))
    lib = pyqms.IsotopologueLibrary(
        molecules        = [ 'DDSPDLPK' ],
        charges          = [ 2 ],
        metabolic_labels = None,
        fixed_labels     = None,
        verbose          = True
    )
    print('{0:-^100}'.format('Library generation'))

    results = lib.match_all(
        mz_i_list = peak_list,
        file_name = 'BSA_test',
        spec_id   = 1165,
        spec_rt   = 29.10,
        results   = None
    )
    for key, i, entry in results.extract_results():
        p = pymzml.plot.Factory()
        label_mz_error = []
        label_i_error  = []
        measured_peaks = []
        matched_peaks  = []
        peak_info = ddict(list)
        # pprint.pprint(entry.peaks)
        for measured_mz, measured_intensity, relative_i, calculated_mz, calculated_intensity in entry.peaks:
            if measured_mz is not None:
                measured_peaks.append(
                    (
                        measured_mz,
                        measured_intensity
                    )
                )
                matched_peaks.append(
                    (
                        calculated_mz,
                        calculated_intensity * entry.scaling_factor
                    )
                )
                mz_error = (measured_mz - calculated_mz) / ( measured_mz * 1e-6 )
                label_mz_error.append(
                    (
                        calculated_mz,
                        '{0:5.3f} ppm m/z error'.format(
                            mz_error
                        )
                    )
                )
                scaled_intensity = calculated_intensity * entry.scaling_factor
                rel_i_error  = abs(measured_intensity - scaled_intensity) / scaled_intensity

                peak_info['measured peaks'].append(measured_mz)
                peak_info['theoretical peaks'].append(calculated_mz)
                peak_info['relative intensity'].append(relative_i)
                peak_info['scaled matched peaks'].append( calculated_intensity * entry.scaling_factor )
                peak_info['mz error'].append( mz_error)
                peak_info['i error'].append(  rel_i_error )


                if rel_i_error > 1:
                    rel_i_error = 1

                label_i_error.append(
                    (
                        calculated_mz,
                        '{0:5.3f} rel. intensity error'.format(
                            rel_i_error
                        )
                    )
                )


        mz_only  = [ n[0] for n in measured_peaks ]
        mz_range = [ min(mz_only)-1, max(mz_only)+1 ]
        peptide = results.lookup['formula to molecule'][key.formula][0]
        p.newPlot(
            header = 'Formula: {0}; Peptide: {1}; Charge: {2}\n Amount: {3:1.3f}; Score: {4:1.3f}'.format(
                key.formula,
                peptide,
                key.charge,
                entry.scaling_factor,
                entry.score
            ),
            mzRange = mz_range
        )
        p.add(
            measured_peaks,
            color = (0, 0, 0),
            style = 'sticks'
        )
        p.add(
            matched_peaks,
            color = (0, 200, 0),
            style = 'triangles'
        )
        p.add(
            label_mz_error,
            color = (255, 0, 0),
            style = 'label_x'
        )
        p.add(
            label_i_error,
            color = (255, 0, 0),
            style = 'label_x'
        )

        plot_name = os.path.join(
            os.pardir,
            'data',
            'Score_visualization_Peptide_{1}_Charge_{2}.xhtml'.format(
                key.file_name,
                peptide,
                key.charge
            )
        )
        p.save(
            filename = plot_name,
            mzRange  = mz_range
        )
        print(
                'Plotted file {0}'.format(
                    plot_name
                )
            )
        # print(entry)
        print('Match info')
        for key, value_list in sorted(peak_info.items()):
            print(key)
            print('[{0}]'.format(','.join([str(n) for n in value_list])))
            print()
    return


if __name__ == '__main__':
    main()